Open PHP stack trace links in PhpStorm
6.5.2014
Inspired by a tweet from Wouter, i wanted to configure my setup to open stacktrace links directly in PhpStorm. Turned out there was more involved than i thought at first. Documentation is sparse and confusing, so i want to record the steps i needed here. Basically you need to configure xdebug.file_link_format and make your system handle a new protocol. Its less complicated than it sounds:
Just configure the xdebug extension in your php.ini to set
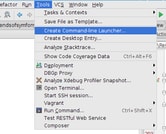
PhpStorm can create a command line launcher allowing you to open files in a running PhpStorm instance. Go to Tools > Create Command-line Launcher... and let it create the launcher. Remember the path to the binary for later.
The launcher unfortunately can not handle URLs, so we need a wrapper script. This can be really simple:
/usr/local/bin/pstorm-handler
If you called the protocol differently, change the REGEX accordingly. If your PhpStorm created the pstorm cli command somehwere else, change the path accordingly.
This script is inspired by the LinCastor script but simplified.
The last bit is to tell your OS how to handle pstorm:// URLs. Ideally you set this on the operating system level. I found this article for KDE4 and Gnome. If you do not get things to work, you can also register a custom handler in your browser. For firefox, go to about:config and then Right-click -> New -> Boolean -> Name: network.protocol-handler.expose.pstorm -> Value -> false. Then click on a link and select the pstorm-handler script. (If you got the last bit wrong, go to Preferences > Applications and look for pstorm in there).
Configure XDebug
Just configure the xdebug extension in your php.ini to set
xdebug.file_link_format = pstorm://%f:%l
This also works for Symfony2 exception pages because Symfony2 looks at the xdebug.file_link_format setting.PhpStorm command line launcher
PhpStorm can create a command line launcher allowing you to open files in a running PhpStorm instance. Go to Tools > Create Command-line Launcher... and let it create the launcher. Remember the path to the binary for later.
URL handler
The launcher unfortunately can not handle URLs, so we need a wrapper script. This can be really simple:
#!/bin/bash

REGEX="^pstorm://(.*)$"


if [[ $1 =~ $REGEX ]]; then

    /usr/local/bin/pstorm "${BASH_REMATCH[1]}"


    exit 0

fi


exit 1
/usr/local/bin/pstorm-handler
If you called the protocol differently, change the REGEX accordingly. If your PhpStorm created the pstorm cli command somehwere else, change the path accordingly.
This script is inspired by the LinCastor script but simplified.
Register URL handler
The last bit is to tell your OS how to handle pstorm:// URLs. Ideally you set this on the operating system level. I found this article for KDE4 and Gnome. If you do not get things to work, you can also register a custom handler in your browser. For firefox, go to about:config and then Right-click -> New -> Boolean -> Name: network.protocol-handler.expose.pstorm -> Value -> false. Then click on a link and select the pstorm-handler script. (If you got the last bit wrong, go to Preferences > Applications and look for pstorm in there).

